How to Calculate Pour Cost (And Why 20% Is the Wrong Target)
The first beverage director I worked under handed me a clipboard one Sunday and said “the target is 20%.” Six months later I figured out the target was wrong. Not 20% specifically. The whole idea that one number could measure a bar program with beer, wine, and spirits all priced differently and pouring differently was the part that was off.
This is the version of pour cost I wish somebody had explained to me the first time I set a target.
The formulas #
There are two pour cost formulas, and most operators use them interchangeably and confuse themselves.
Aggregate pour cost:
Pour cost % = Bar COGS ÷ Bar Sales × 100
This is the P&L version, same structure as food cost. Useful for tracking the whole bar program against a single number.
Per-drink pour cost:
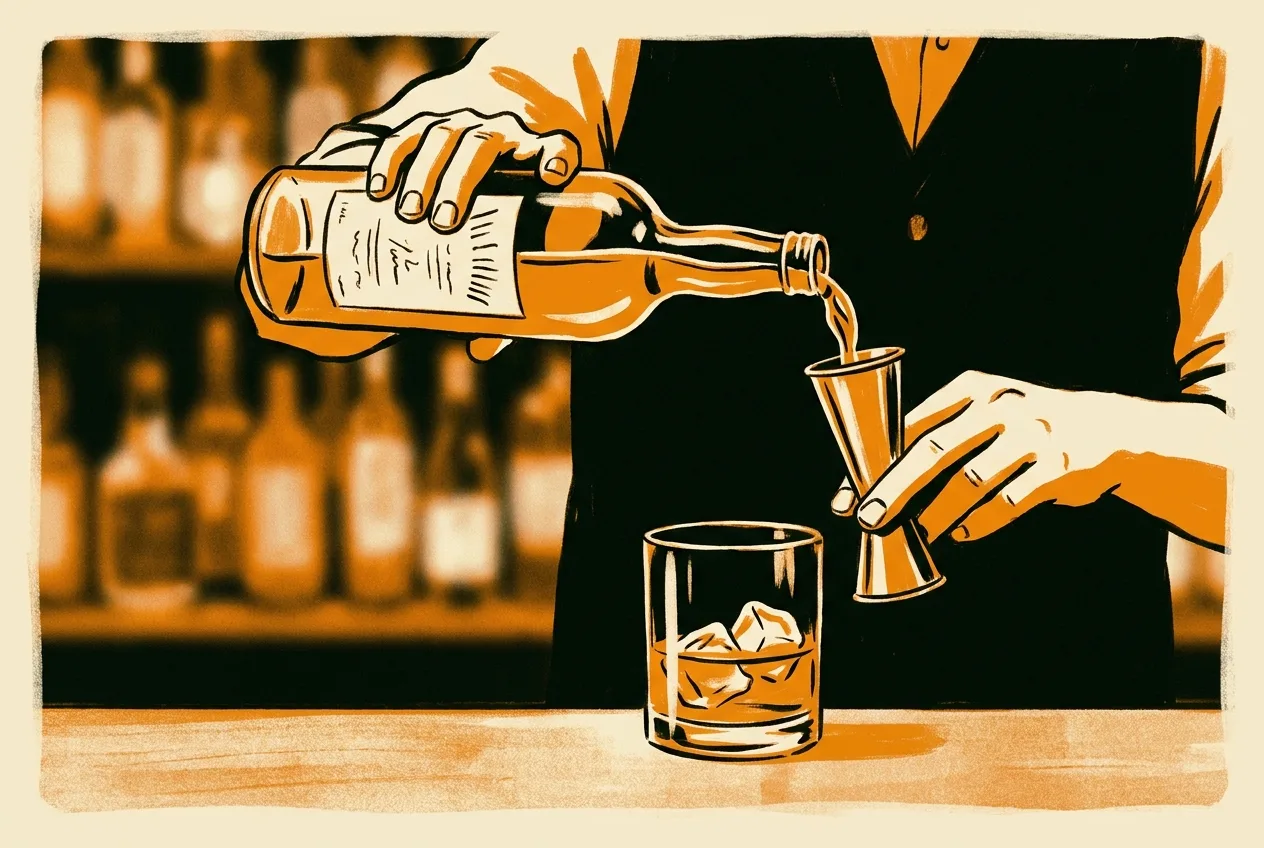
Drink pour cost = (Bottle cost × Pour oz) ÷ (Usable oz per bottle × Drink price)
This is the recipe version. It tells you the cost of one specific drink, which is what you want for pricing decisions and spec-sheet work.
A 750mL bottle is 25.4 oz. At a 1.5 oz pour spec, that is 16.9 drinks per bottle. Account for spillage and finish-off-pours (usually 1-2 drinks of waste per bottle), call it 15 servable drinks from a 750mL. A 1.75L bottle (59.2 oz) yields about 38 servable drinks at 1.5 oz pour.
A worked example #
Say a bottle of well vodka costs you $24 from the distributor. Standard 1.5 oz pour. You sell the vodka soda for $9.
- Cost per drink: $24 ÷ 15 servable drinks = $1.60
- Pour cost: $1.60 ÷ $9.00 = 17.8%
Healthy on a well drink.
Same bottle, real-world bartender pour: 1.75 oz (industry-average actual pour, Backbar, Sculpture Hospitality). At 1.75 oz, the same bottle yields 14.5 drinks, minus 1 for spillage, 13.5 servable drinks.
- Real cost per drink: $24 ÷ 13.5 = $1.78
- Real pour cost: $1.78 ÷ $9.00 = 19.8%
That is a 2-point shift, and all of it lives in the gap between spec and what actually goes in the glass. Multiplied across 80 well-vodka drinks a week, that’s $14.40 of margin disappearing into the over-pour. Multiply by every well bottle on the rail and the number gets serious fast.
Why a single 20% target is operator nonsense #
A 20% blended pour cost target is fine as a back-of-envelope check. As an operational target it’s wrong, because beer, wine, and spirits pour nothing alike.
Industry targets by category (Backbar, Provi, BinWise):
- Spirits / liquor: 14-18% (highest margin category)
- Beer (bottle): 24-30%
- Beer (draft): 18-24%
- Wine (BTG): 22-30%
- Wine (bottle service): 28-35%
- Cocktails (blended): 18-22%
- Total beverage program: 18-24%
Run a single 20% target against a bar that does 50% beer / 25% wine / 25% spirits and the math lies to you. What you actually want is each category’s variance against its own target, because that’s the part that tells you where to go look. A blended 22% pour cost could be 17% spirits (great), 26% beer (bad), 24% wine (slightly hot), and now you know exactly which category needs work. Or it could be 22% across the board (fine) and tell you nothing you can act on.
The 1.5 oz pour myth #
Most bars run a 1.5 oz pour spec. Then most bartenders actually pour 1.75-2 oz, especially on well drinks, and especially when the only thing enforcing the spec is a free-pour count instead of a jigger.
Industry-average actual pour (measured studies):
- Free-pour, untrained: 1.85-2.0 oz on a 1.5 oz spec
- Free-pour, trained: 1.6-1.75 oz on a 1.5 oz spec
- Jiggered: 1.45-1.55 oz on a 1.5 oz spec (slight over from the lip)
- Speed-pour spout, free-pour: 1.65-1.85 oz on a 1.5 oz spec
- Speed-pour with portion control device (Berg, Easybar, etc.): within 0.05 oz of spec
The cost of free-pour: typically 8-15% over-pour, which translates to 1.5-3 points of pour cost above what the spreadsheet says. On a $400K annual beverage program, that is $6,000-$12,000 lost to pour technique.
The fix is jiggers. Not portion-control devices, which are expensive and kill bar flow. Just jiggers, on the rail, with a manager who actually checks. The first three weeks are miserable because the bartenders complain, and they will let you know about it. Then the fourth week the pour cost drops 2 points and the complaints stop. Every time.
A worked example: when 20% on paper costs you 26% in reality #
The same well vodka example, with everything that can go wrong:
- $24 bottle cost
- 1.5 oz spec → 1.85 oz actual pour (free-pour)
- 25.4 oz bottle ÷ 1.85 oz = 13.7 theoretical drinks
- Minus 1.5 drinks spillage and finish = 12.2 servable
- One free pour per bottle (the bartender’s friend at the end of the night)
- 11.2 paid drinks per bottle
- Real cost per drink: $24 ÷ 11.2 = $2.14
- $9 menu price
- Real pour cost: $2.14 ÷ $9 = 23.8%
The spreadsheet said 17.8%. Reality said 23.8%. That 6-point gap is just over-pour, spillage, and one free drink per bottle stacked on top of each other. Multiply by 80 bottles a week and you’re staring at $500/week in margin that nobody is tracking.
Variance: where the gap actually lives #
When pour cost runs above the category target, the variance is hiding in one of six places. Roughly in order of how much damage each one does:
- Over-pour from free-pouring. The big one. 60-70% of pour cost over-runs trace here.
- Comps without manager approval. “Buy-back” culture in bars that comp a drink for every 3 sold. Sometimes a deliberate hospitality move, sometimes loose discipline.
- Free pours / friend pours / industry-pour. Bartenders pouring their friends $0 drinks. Common, often unreported.
- Spillage and waste during service. 2-4% of bar volume on a well-run bar, 6-10% on a sloppy bar.
- Wrong glassware. Pouring a 9 oz wine into a 6 oz spec because the only clean glass is a larger one.
- Inventory and receiving errors. Bottles that show as received but never made it to the bar (theft at the receiving dock, breakage not recorded).
For each leak in detail, see 5 Ways Bar Pour Cost Actually Leaks.
What this looks like in the calculator #
The liquor pour cost calculator on this site runs both formulas, aggregate (for your weekly tracking) and per-drink (for spec work). It handles spillage adjustment, free-pour over-pour modeling, and benchmarks by category, so you can see where each part of the program lands against the right target instead of one blended number that hides everything.
What to do today #
Pull last week’s bar sales by category if your POS supports it, then pull last week’s bar invoices. Calculate pour cost separately for beer, wine, and spirits, and compare each one against the segment targets above. Whichever category runs furthest above its target is where the leak is. Fix that one before you go averaging the others out.
If your POS doesn’t separate bar sales by category, that’s the first fix to make. A bar program without category-level visibility is a bar program running blind, and you won’t catch the leak until it’s already cost you a month of margin.
Sources: Backbar, BinWise, Provi, Sculpture Hospitality, BevSpot.
Read next
What's a Good Prime Cost for a Bar vs a Restaurant?
A healthy prime cost by concept, why bars run lower than kitchens, and what your number should be. The benchmark, not the formula. From a 5-year GM.
How to Price a Cocktail (The Pour Cost Math Bars Skip)
How to price a cocktail off its real pour cost, the multiplier that works, and a worked build from spirit to menu price. From a 5-year bar GM.